
If you ask an Elon PWR student what they love about their program of study, they will almost always bring up the amazing faculty that make the PWR program what it is. Besides developing intriguing and practical curricula for their classes and going out of their way to help students achieve their goals, the PWR professors also work on a variety of research projects that contribute to national and international discussions in the fields of writing and rhetoric. One of these faculty members is Dr. Li Li, an Assistant Professor of English and the PWR Major Coordinator, who had an article published about her research earlier this year. Dr. Li’s rhetorical analysis appeared in the journal Technical Communication Quarterly in January 2020 and is cited at the end of this post, and she offered more insights into her research process and results here:
How did you develop the idea for your recent article?
This article is a rhetorical analysis of the visual representation of Chinese immigrants in the Statistical Atlases of the United States. It all started when I accidentally encountered a population graph from the Statistical Atlases produced by the U.S. Census Bureau in the late 19th century.
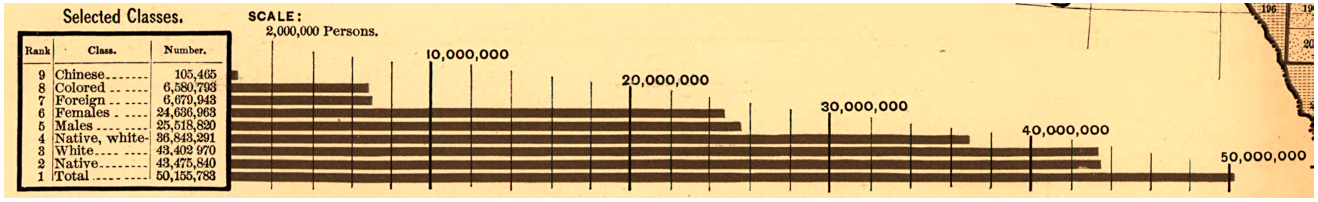
Total Population, Selected Classes: 1880 (Gannett & Hewes,1883 Atlas Plate 22)
The American population was classified as follows: native/foreign, colored/white, males/females, and Chinese. Standing alone at the very top of the bar chart, “Chinese” immediately caught my eye. It was intriguing to me why “Chinese,” with a very small population size, was selected and represented as a major population category in this graph produced in the late 19th century. In order to understand the rhetorical decisions behind this graph, I started researching population graphs based on census data in the late 19th century and early 20th century and the historical context of the time period. And I decided to write an article about this.
What methods did you use to study your topic?
I used rhetorical analysis, archival research, and cultural studies methodologies in this study. I collected my data from the historical Statistical Atlases in the late 19th and early 20th centuries. Some of the atlases are available electronically from the Library of Congress website, but some can only be read in the archival section in the library. Touching and turning the pages of the 200-year-old atlases was a memorable experience for me. Archival reading was also a kind of directed ramble, but by reading through several thousand graphs in the atlases, I did find the information I set out to discover.
What was the most interesting thing (in your opinion) that you found in your research?
As my research progressed, I began to see the relationship that historical events, especially the Chinese Exclusion Act, had with the designer’s political agenda and the rhetorical choices made in the data displays. Data visualizations like population graphs could function as an exercise of state disciplinary power and social control over citizens and non-citizens, especially the undesirable and unproductive “others.”
Do you think this research will influence your studies of writing and rhetoric further?
Definitely. I have always been interested in the study of visual rhetoric. In future studies, I would like to examine more broadly how power and authority work in data designs and study inequities, such as racism and xenophobia, in visual communication practices. The project also contributes teaching materials to my classes on the discussion of history and conventions of data visualization, and ethics in creating and using data displays. This project can be used as a case study in my class to foster critical thinking and help students to become more ethical designers of data displays.
What do you hope that your research will accomplish, or what do you hope people take away from your research?
As I stated in my article, I hope the study will “raise critical awareness of the invisible politics and ideologies present in the visual language of historical data displays.” I also hope communicators will be informed on what visual strategies can be used to advance rhetorical purposes today.
If you want to read Dr. Li’s article, this is the citation to search:
Li Li (2020). Visualizing Chinese Immigrants in the U.S. Statistical Atlases: A Case Study in Charting and Mapping the Other(s), Technical Communication Quarterly, 29:1, 1-17, DOI: 10.1080/10572252.2019.1690695
 Follow