
This week, as we all know, is Preregistration week! To help you with your class selection, I’ll be discussing the PWR Special Topics Course for this fall: Data & Information Visualization.
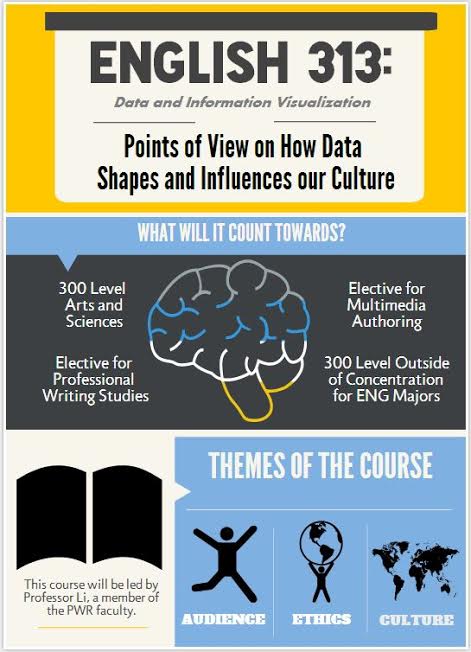 Topics: Data & Information Visualization will be taught by Dr. Li, a new professor to our PWR department, and will be held Mondays and Wednesdays from 1:40-3:20. This course will focus on the rhetoric of visualized data – that is information in charts, graphs, maps, etc. – and they ways in which visualized data is displayed and understood. One of the major focuses in this course is the historical development and the emergence of new forms of data visualization.
Projects in this course will include graphic analyses and the creation of contextual data displays, both individually and in groups. Students will learn a variety of software through tutorial readings and exercises, including Excel, Adobe Illustrator, Adobe InDesign, and Google Charts, which they will use in the creation of their data displays.
If you’re interested in learning about visual rhetorics and the development of data and information visual displays, register to ENG 313-A Topics: Data & Information Visualization, and be sure to check back Wednesday for a post about our new PWR professor, Dr. Li!
 Follow